orbtymon
How to Export Metrics to an OTLP Endpoint
Problem
Section titled “Problem”You want to analyze your orbtymon monitoring data alongside other telemetry data in your existing observability platform (like Grafana, New Relic, or Honeycomb). You need a standardized way to export these metrics without building a custom integration.
Solution
Section titled “Solution”orbtymon can export monitoring metrics to any OTLP (OpenTelemetry Protocol) compatible endpoint. By adding a simple configuration to your orbtymon.yaml file, you can have metrics from every check sent directly to your monitoring stack.
Prerequisites
Section titled “Prerequisites”- An observability platform that supports OTLP metric ingestion over HTTP.
- An
orbtymon.yamlfile to configure your monitors. - The orbtymon CLI to apply your configuration.
Step-by-step guide
Section titled “Step-by-step guide”1. Locate your OTLP endpoint URL and headers
Section titled “1. Locate your OTLP endpoint URL and headers”First, you need to find the specific URL and any required authentication headers from your observability platform. This is usually found in the documentation under “OTLP,” “OpenTelemetry,” or “Metrics Export.”
- Endpoint URL: Look for an HTTP endpoint for OTLP metrics. It will typically end in
/v1/metrics. For example:https://otlp.your-provider.com/v1/metrics. - Headers: You will likely need an authentication header, such as
Authorization: Bearer YOUR_API_KEYorX-API-Key: YOUR_API_KEY.
2. Configure your orbtymon.yaml file
Section titled “2. Configure your orbtymon.yaml file”Open your orbtymon.yaml file and add the openTelemetry block at the top level.
# yaml-language-server: $schema=https://www.orbtymon.app/schema.json
openTelemetry:  endpoint: <YOUR_OTLP_ENDPOINT_URL>  headers:    Authorization: Bearer <YOUR_TOKEN>    # Add any other required headers here
# Your monitors are defined belowmy-first-monitor:  # ...
Replace <YOUR_OTLP_ENDPOINT_URL> and <YOUR_TOKEN> with the values you found in step 1.
Note: Currently, we only support OTLP over HTTP.
3. Apply the configuration
Section titled “3. Apply the configuration”Use the orbtymon CLI to apply the changes to your account.
orbtymon applyAfter applying the configuration, orbtymon will send metrics to your specified endpoint after every check is completed.
4. Verify in your observability platform
Section titled “4. Verify in your observability platform”Go to your observability platform and look for the new metrics coming from orbtymon. You should be able to build dashboards and alerts based on this data.
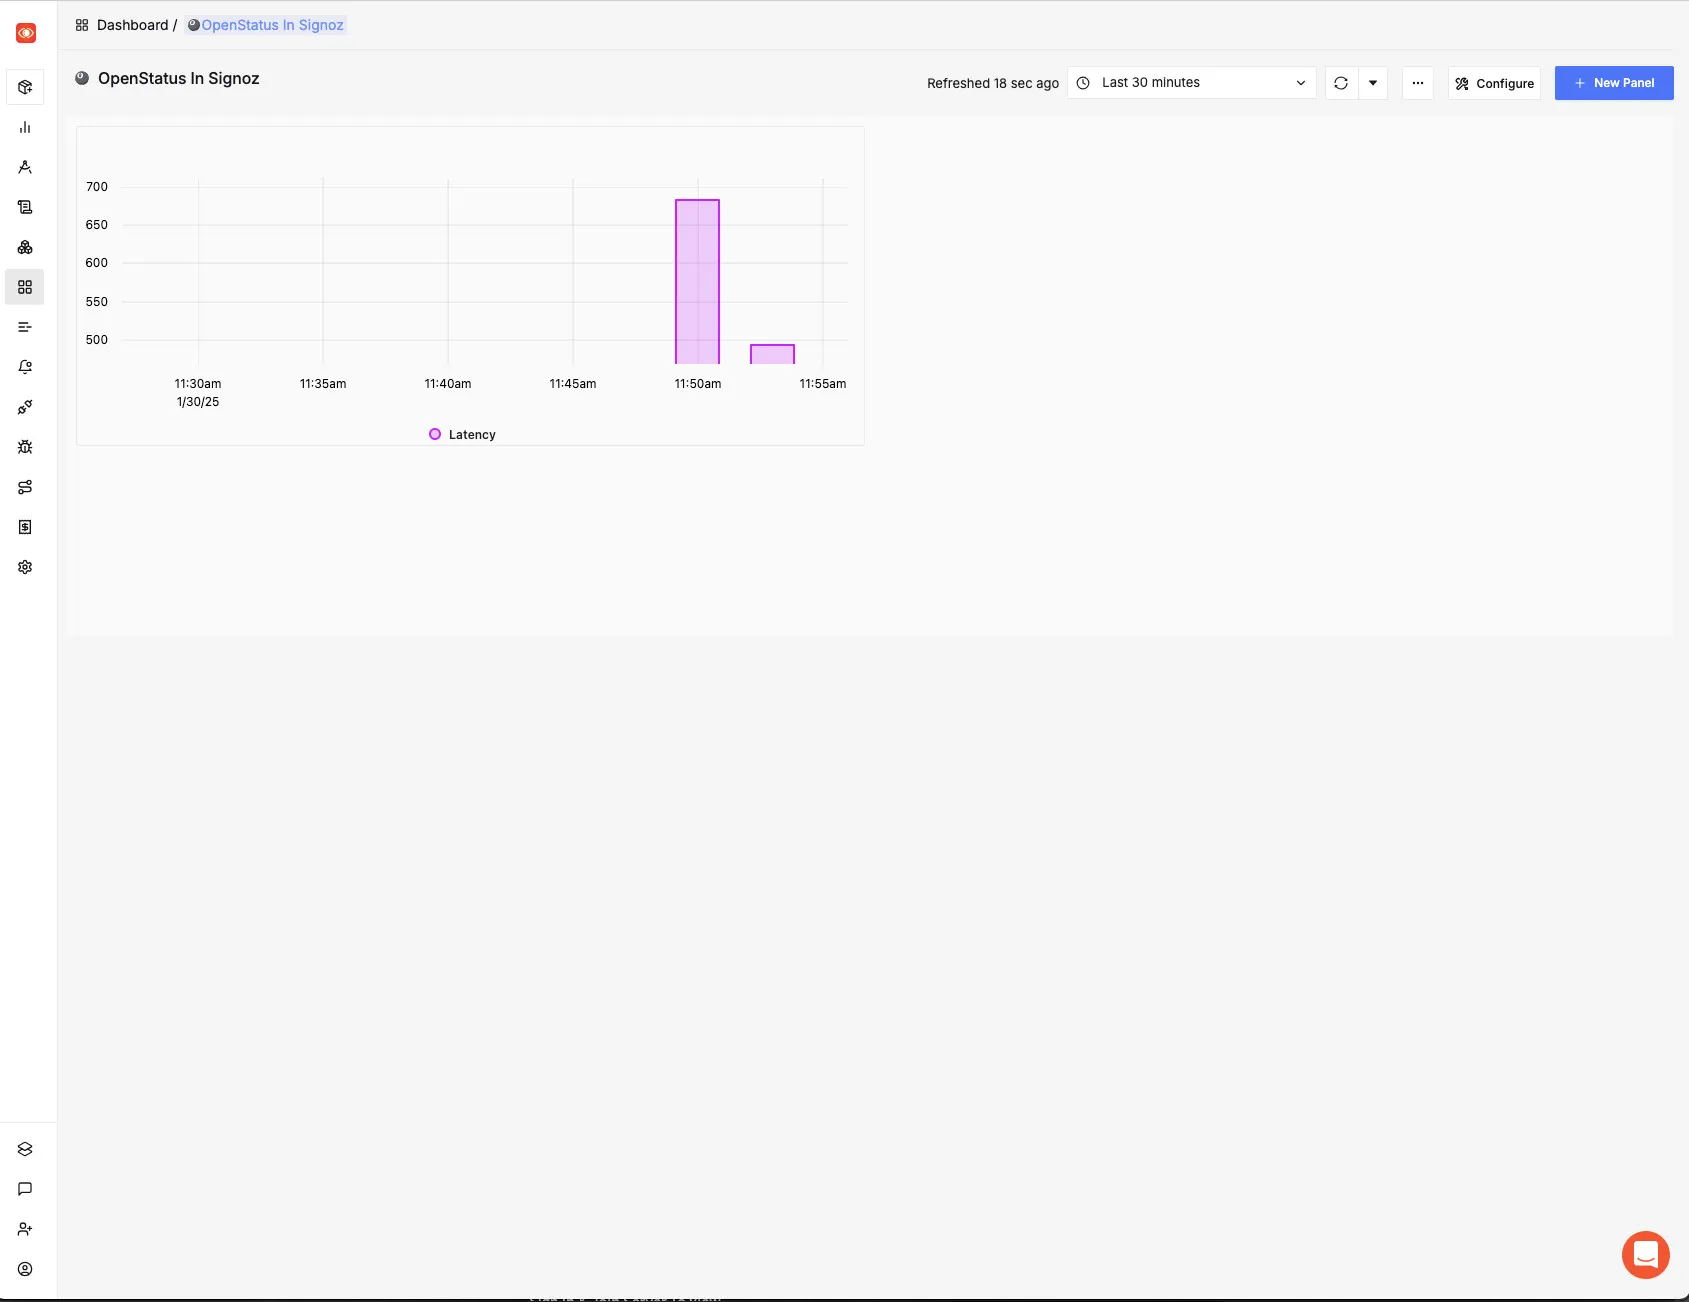
Here are some examples of what it can look like:
Grafana
Section titled “Grafana”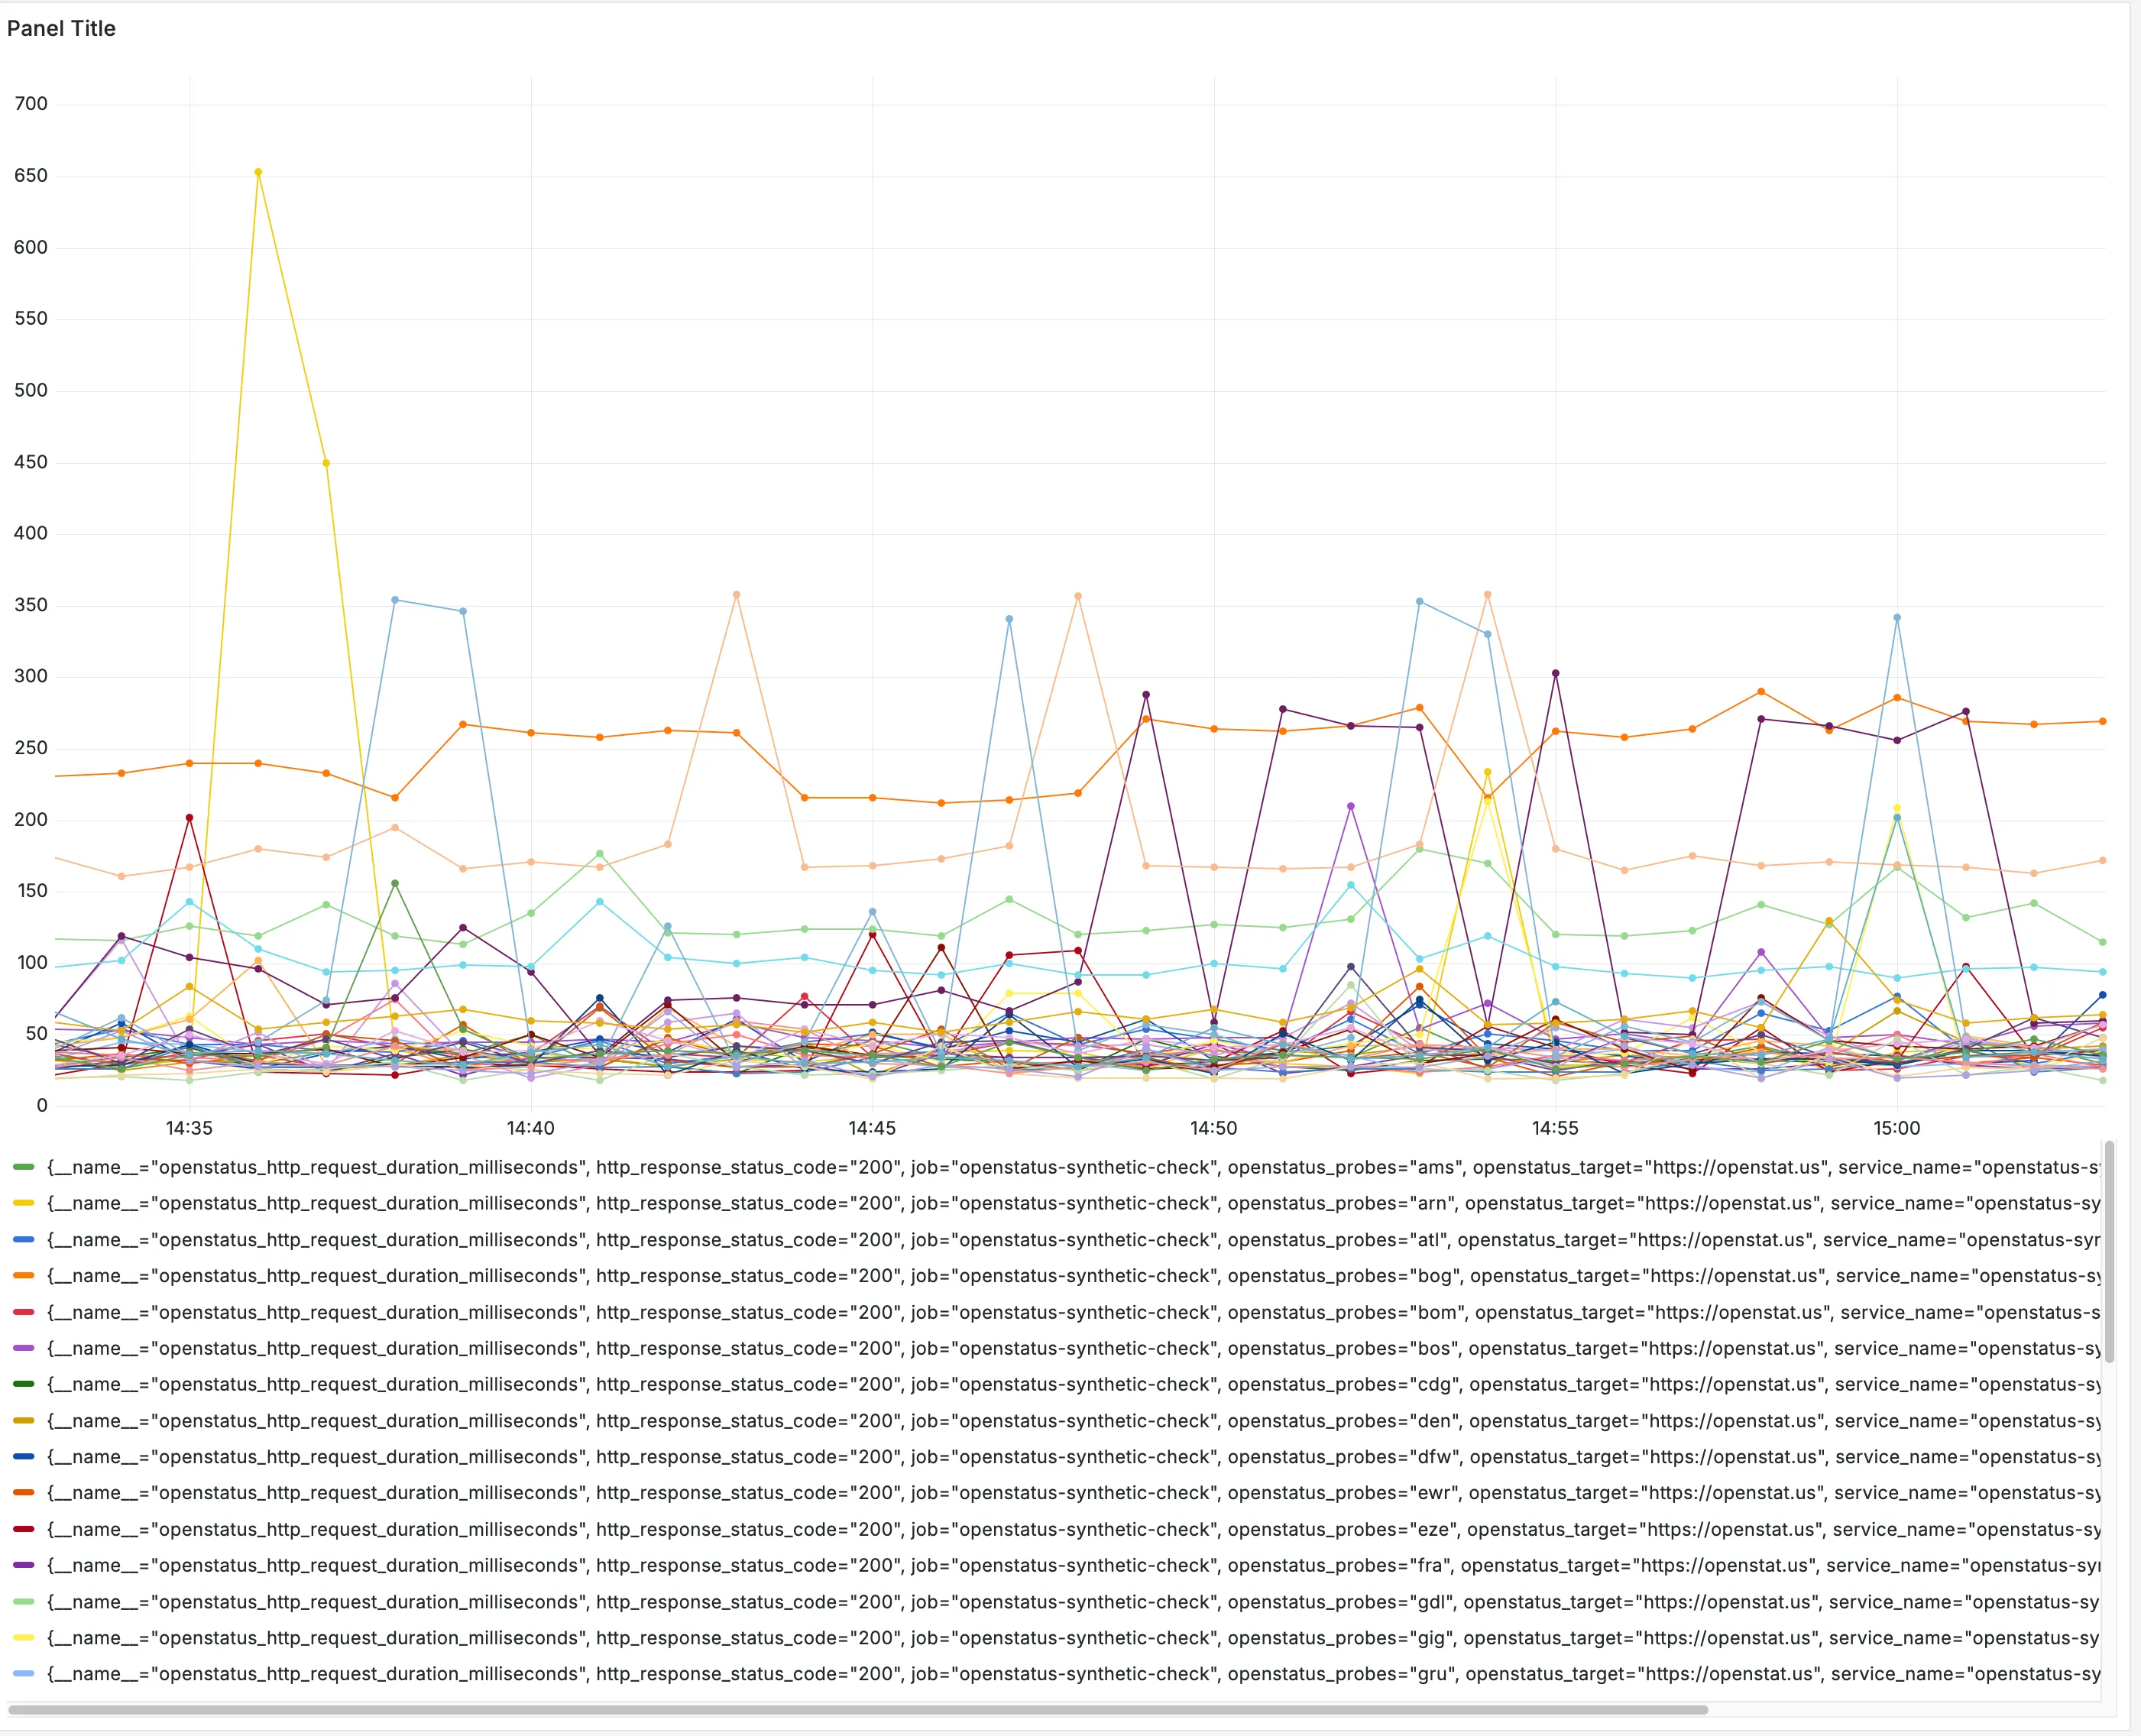
Honeycomb
Section titled “Honeycomb”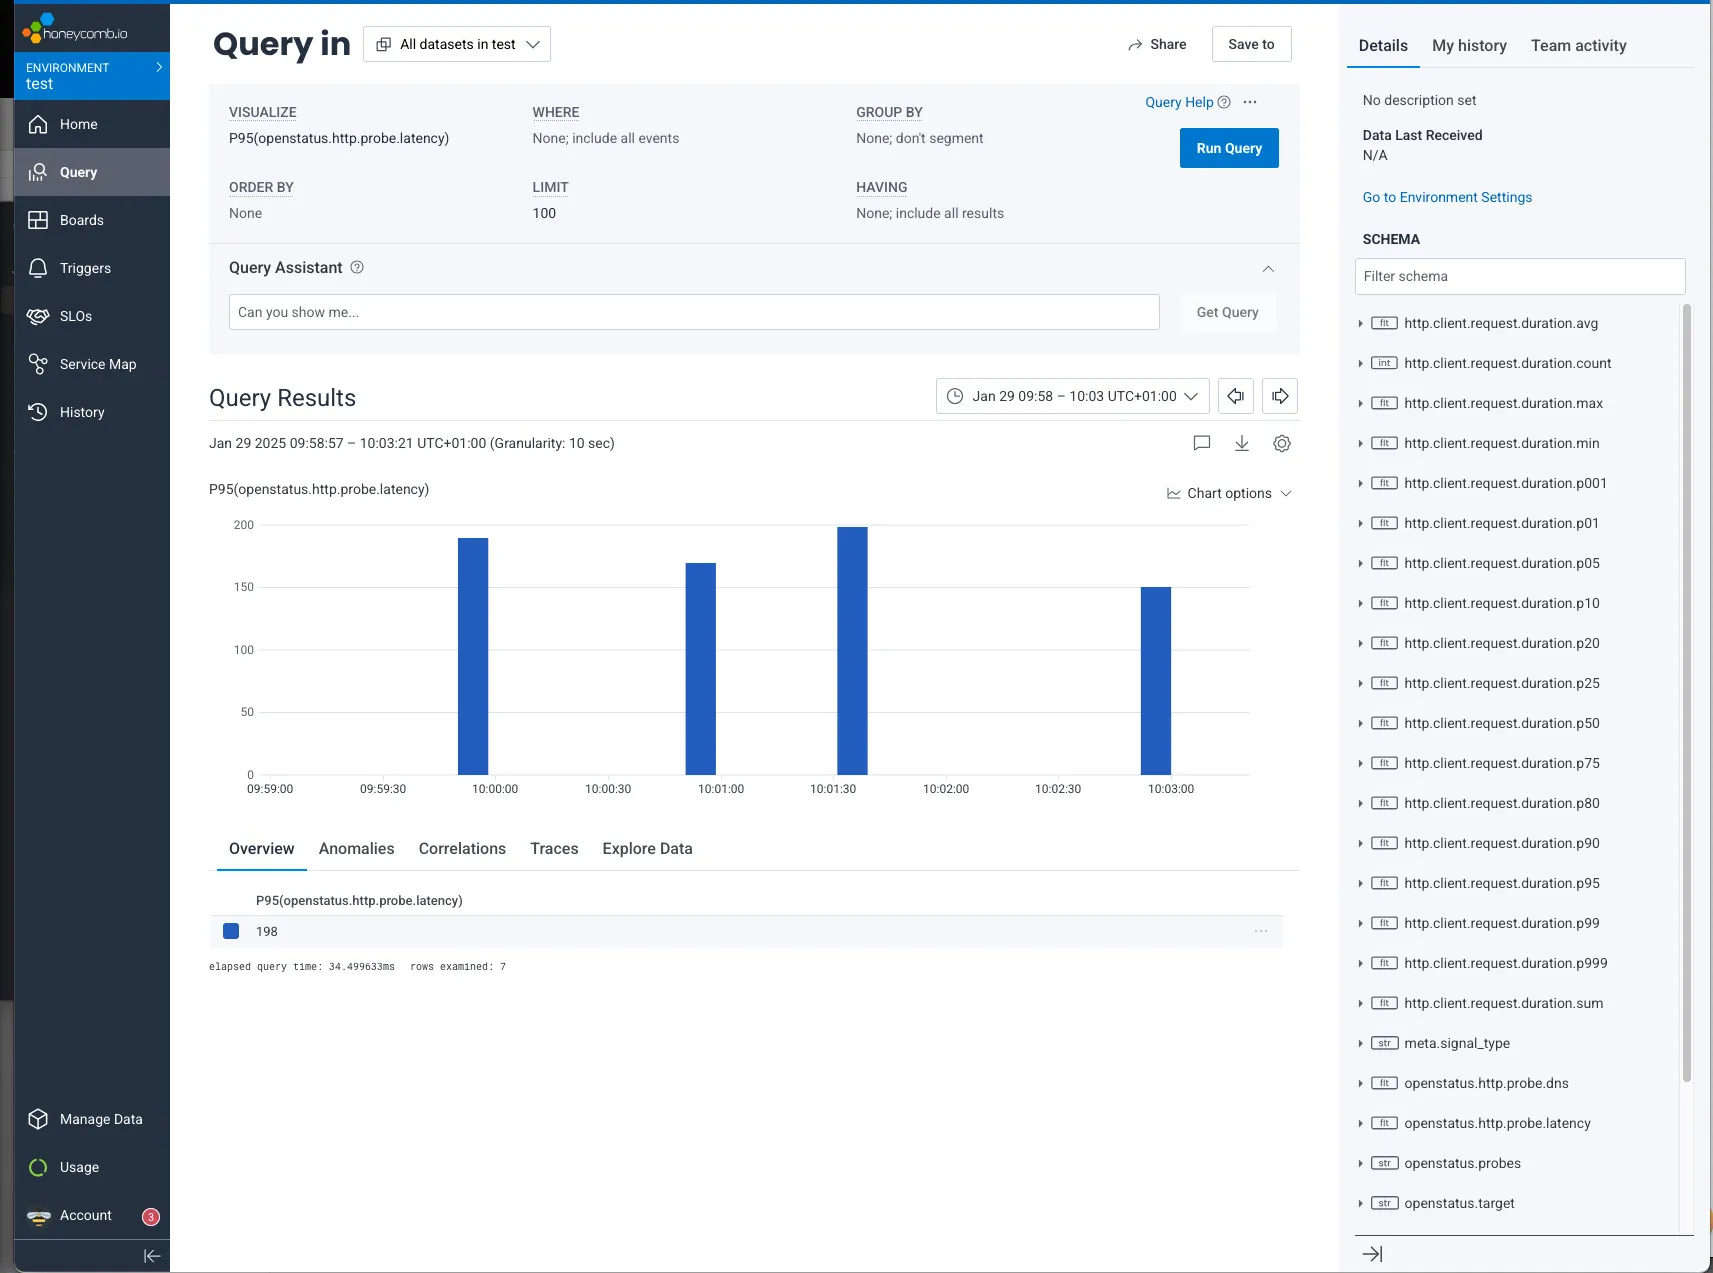
New Relic
Section titled “New Relic”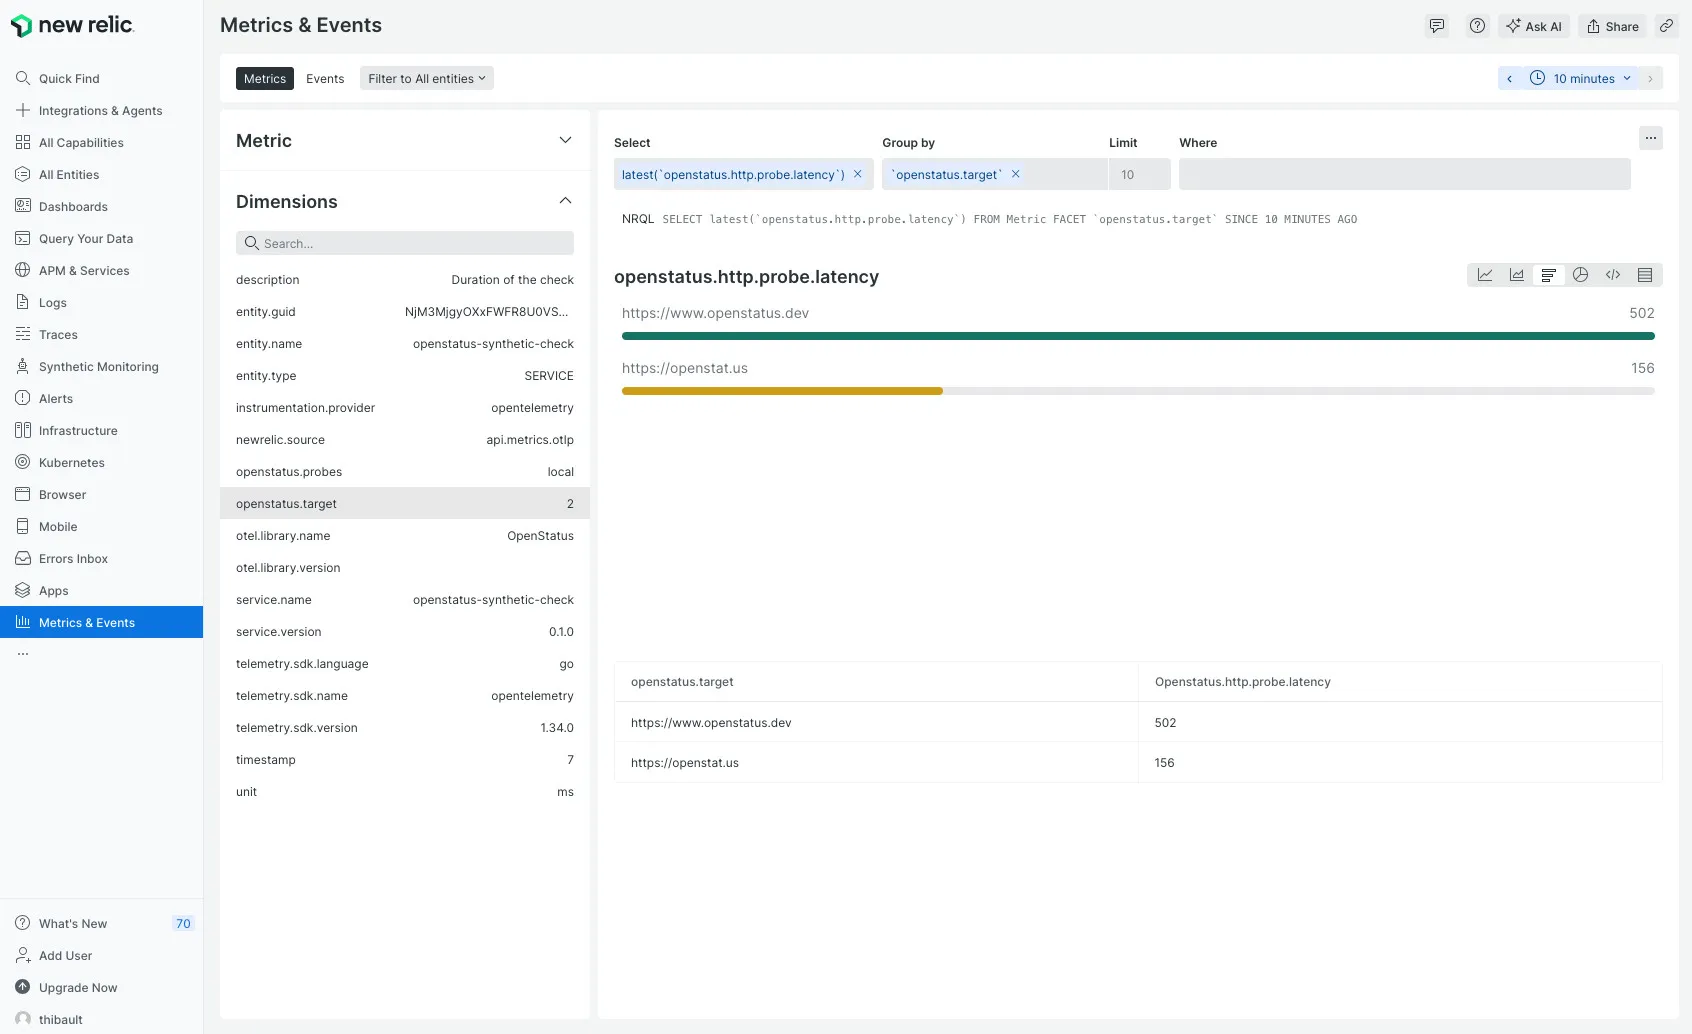
SigNoz
Section titled “SigNoz”